Best Scalping Trading Strategy free 2025
I just made $860 this morning and yesterday I made over $33,000 trading this incredibly easy and consistent scalping strategy that only takes 30 minutes every morning. I challenge you to trade this strategy for the next month just one trade a day and see how drastically your trading changes.
Rewind and Walkthrough
So let’s rewind it yesterday and let me walk you through how I found and entered into the trade. I made $3,000 in under 30 minutes.
Analyzing the Larger Time Frame
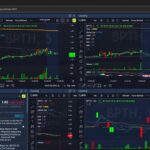
The first thing I do every morning when I come and look at the charts is I actually look at a larger time frame than what I trade. So right here on the right side, this is my trade going on a one-minute chart, but the first thing I do is I actually look at a 15-minute chart.
What we’re doing is we’re looking at NASDAQ futures, and I just see, okay, what has the market been doing recently? What has the NASDAQ been doing, and going into today, where is it likely to find potential bounces? Because I want to look for reversals. I’ve just found that over time, reversals are way more profitable consistently for me, especially doing this strategy.
Analyzing the 1-Minute Chart
So I’ll just go into the day and say, okay, well, there’s really good overnight action right here, and then, you know, there’s a support level all the way down here. Then I’ll go into a one-minute chart here and I’ll look at, okay, what does the price action look like? I don’t use any indicators; all I do is I look at the trends and the movement of the market. I’ve just found that that’s way simpler to identify.
Find what’s going on, and clearly we can look at and see, just kind of big picture here on a one-minute chart, is the market’s coming down and it’s bounced, it comes down here, and then it’s come up here and it’s essentially retesting the same area.
Checking for Trend Break
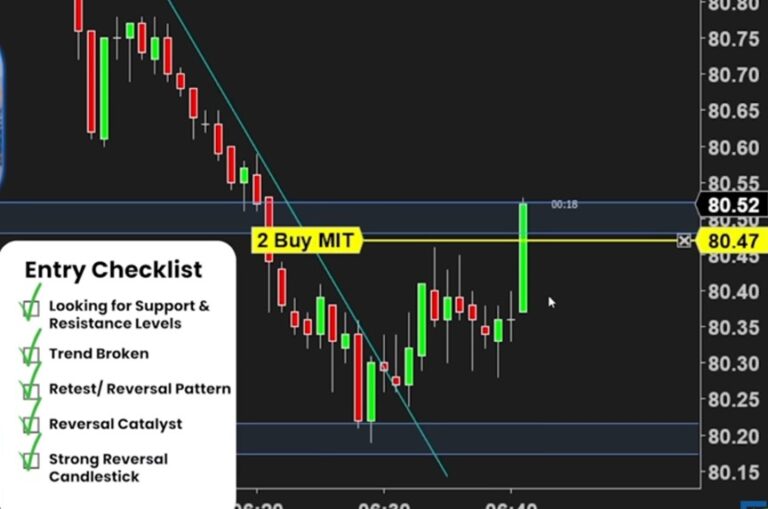
The way I like to look at it is, well, okay, the trend could keep going up or it could reverse at this area up here, this resistance zone. And so I see that there is a really strong trend line going up here and it’s broken. So I kind of have a five-step entry checklist I use to pretty much simplify getting into every trade. It just makes it really easy to follow a plan and consistently find these.
- Step One is finding this support/resistance level to trade off of.
- Step Two is seeing, okay, where is this kind of current trend and we need that to be broken because if the market’s going to reverse down here, well, that uptrend needs to be broken, right?
So this right here is amazing in terms of what a really, really good trend looks like in terms of its potential to go down. Just how methodical this is, it’s very, very consistent; there’s no big swings. So we can pretty much be really, really confident that as soon as it starts to go sideways here and it has this break lower that it’s lost that steam, it’s lost the momentum. And I think actually this, if I zoom in here, these two candlesticks right here show a really, really strong pickup in sellers potentially pushing the market lower.
Mastering the Dip and Rip Day Trading Strategy: A Detailed Guide
Assessing Market Signals
So from there, you know, the market opens up at 6:30 here, the NASDAQ futures, and so I am thinking, okay, this looks really good. I need to wait for the market to open though to enter in on a trade here. And then the final thing here is, well, the fourth step, actually, the NASDAQ here comes down and it has this big bullish bar. Essentially what it’s doing is the market comes down, it makes an attempt to keep going lower, it kind of finds some support and then it pushes higher right here, and then that actually fails and it sells off this big bearish bar.
Placing the Trade and Managing Risk
So what this does is it really confirms for me in my fourth step that the market’s shown me strength to get to the downside and it’s failed an attempt to keep going up. You know, if this bullish bar right here had some more bullish bars like this, I would think, okay, maybe it’s just a, you know, a quick pullback in this uptrend, it’s going to keep going higher. But seeing that get rejected here gives me a lot of confidence that the market’s going to reverse there.
So then to jump in on the trade, I wanted to wait for the market to essentially open, make one more attempt higher, and then make a big bearish bar going lower. This happened so fast that I don’t have the recording of this bar forming in real-time to show you, but essentially the market, this is the candlestick at 6:30 of the NASDAQ futures opening, and so it opened here, it went up, and it started to sell off really hard.
I put in an order right here, which you can see is this order right here, essentially below this low with the idea that, hey, if it breaks below this, I want to get in short and catch this swing lower because this is just a really, really solid pattern and the potential for me to capture a larger, bigger picture move was really, really strong.
I initially put my stop loss up here. If I just quickly go back in the recording just to show you, that is, I had my stop loss up here, kind of above this double swing, and then actually I moved it down to break even once this started to play out in my favor. So that’s kind of the whole idea. Once this goes starts to go in my favor a little bit, you want to always give a trade some wiggle room at the beginning, but once it starts to break in your favor, I find it’s really good to take some of that risk off the table and essentially move your stop down to break even and then over time as well is move it further and further.
Example of NASDAQ Trade
So I have a tool on this trader I’ve created that I just call the risk-reward calculator, and what it does is it helps me say, okay, I want to risk, if I want to risk $700 on this trade, I need to trade two contracts. And so you can see here I entered in for two contracts, and then this is where I hit one times my risk, so I would make 700. Here’s 2 * 1,400, three times, four times, and so you can see that as it goes down, I essentially manage the trade and I trail up my stop to capture these profits because you don’t want to, you know, just let it potentially swing all the way back on you, right? You need to capture your profits, especially when a trade is going so well in your favor.
Example of Oil Futures Trade
So as this starts to kind of really get going, we’re actually at this support level down here, and this is this big support level right here. And so essentially over these 15 minutes, I’ve caught this. I entered up here and then the market’s trading down here, and so that’s what this square is, is this square right here. And so the idea is, okay, we’re at the lows, could start to see this slow down, and so I trail up my stop pretty tight, and it comes back and knocks me out here, and I capture about $3,000 of profit on that trade. And so that whole trade only took about 30 minutes, and then I was done trading for the day, and this is something I do every day.
Applying the Strategy to Oil Futures
Jumping into the next day, this is now oil futures, and I have just found futures are really, really good for day trading. They give you a ton of leverage and allow you to start with a small account. So looking at oil futures on a 15-minute chart, this is kind of where it opened for the day. I was thinking, okay, we have, there’s kind of a downtrend up here, there’s a minor support level here, and then there’s also, you know, kind of the previous highs right here where the market previously broke out. If it gets even further, there’s a support level all the way down here.
Making Trade Decisions
So as the market kind of sells through and breaks through these levels, because you don’t know where it’s going to bounce, that’s the whole idea is that I’m just using a strategy that I approach the market with, and if those five steps show up, I’ll take a trade, and if it doesn’t, you know, and it just keeps going lower and breaking through a support level, I’ll just wait until it shows up.
That’s the big thing about trading is not being reactionary and having a plan. That’s why I really suggest going into trading every day for the next month and try this strategy out. Try and have a plan that you let the market fit to, and if it doesn’t, you just don’t take a trade, and that’s okay. You don’t need to trade every day to make good money. You can see with the size I’m trading at that it can be very, very profitable very quickly.
Analyzing Oil Futures Trade
Now to rewind this to show you kind of my decision process in getting in so you can now try and use it yourself is we quickly saw where I drew those support levels off of. This is oil on a one-minute chart. The ticker symbol is CL, and I actually use the Ninja Trader platform. You can use whatever platform works for you, but we’re looking at futures.